A Strategic Guide for Investors
Executive Summary
Investors face a pivotal choice. They can place capital in the public stock market, which offers liquidity and transparency. Alternatively, they can commit to private equity, where illiquidity is exchanged for higher potential returns and greater influence. This paper compares both options across performance, risk, control, and suitability, providing clarity for investors seeking balance in their portfolio.
Market Overview
Stock Market (Public Equities):
- Global equity markets represent over $110 trillion in value.
- Accessible to retail and institutional investors.
- Returns historically average 8–10% annually (S&P 500 long-term).
Private Equity (PE):
- Private equity assets under management now exceed $13 trillion globally (Preqin, 2024).
- Primarily open to accredited investors and institutions.
- Returns historically range from 15–25% IRR depending on strategy and fund quality.
Side-by-Side Comparison
| Feature | Stock Market | Private Equity |
| Accessibility | Open to all investors | Limited to accredited investors & institutions |
| Liquidity | Highly liquid – daily buy/sell | Illiquid – capital locked 7–10 years |
| Transparency | Public reporting, audited financials | Limited disclosures, private data |
| Returns | ~8–10% annual average | 15–25% IRR (targeted) |
| Volatility | High, reacts to daily news/events | Low day-to-day volatility, but concentrated risk |
| Control | Limited voting rights | Active management, strategic control |
| Time Horizon | Flexible – short to long-term | Long-term – 7 to 10 years |
Performance Dynamics
- Public Stocks:
Driven by economic cycles, interest rates, and investor sentiment. Priced daily, making them highly volatile but liquid.- Example: During 2022 market downturn, the S&P 500 fell 19.4%, but recovered nearly 24% in 2023.
- Private Equity:
Returns stem from operational improvements, roll-up strategies, and strategic exits. Less exposed to market swings, but outcomes hinge on fund manager skill.- Example: Top-quartile buyout funds have outperformed public equities by 300–500 basis points annually over the last two decades.
Risk Considerations
- Stock Market Risks:
- Market volatility, geopolitical events, inflation sensitivity.
- Easier to diversify across industries and geographies.
- Private Equity Risks:
- Illiquidity: investors can’t easily exit before the fund’s maturity.
- Concentration: capital tied to fewer companies, raising exposure to execution risks.
- Dependence on fund manager skill.
Strategic Role in a Portfolio
- Stock Market Allocation:
Provides liquidity, diversification, and compounding growth. Essential for most retirement accounts and moderate-risk investors. - Private Equity Allocation:
Offers alpha generation and access to value-creation strategies not available in public markets. Best suited for long-term investors seeking outsized returns and willing to trade off liquidity.
Visuals for Investors (Recommended)
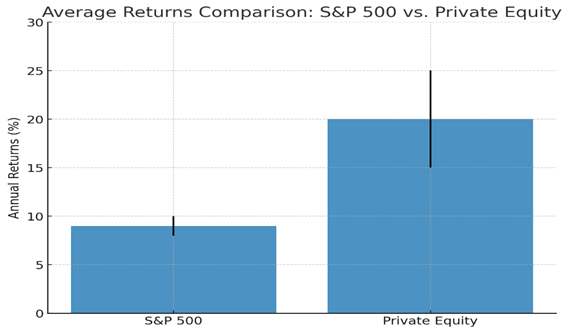
- Bar Chart:
- Compare average returns:
- S&P 500 (8–10%)
- Private Equity (15–25%)
- Compare average returns:
- Pie Chart:
- Suggested Balanced Portfolio Allocation:
- 70% Public Equities
- 20% Private Equity
- 10% Bonds/Alternatives
- Suggested Balanced Portfolio Allocation:
- Timeline Infographic:
- Stock Market: daily liquidity cycle.
- Private Equity: capital lock-in cycle (investment → operational improvements → exit).
Conclusion
The choice between private equity and the stock market is not an either-or decision—it is about portfolio balance. Public markets offer flexibility. They also offer diversification. Private equity has the potential for superior long-term returns. This is achieved through active management and strategic exits.
Key takeaway: Investors with liquidity needs and lower risk tolerance should lean toward the stock market. Those with longer time horizons and higher risk capacity can enjoy private equity as a high-return, low-correlation complement.